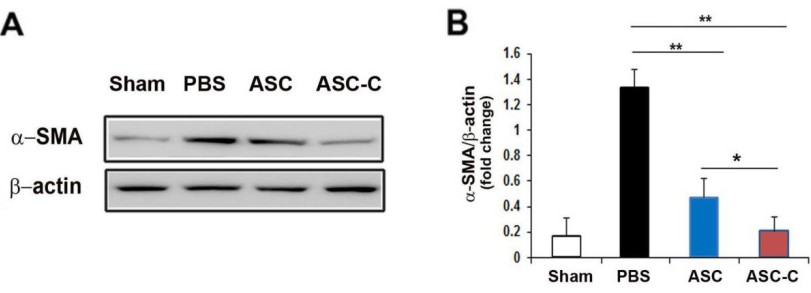
Fig. 8. In vivo therapeutic mechanism effects of ASC-C. (A) Representative images of Western blot results in cell injected liver. (B) Quantitative analysis of western blot results. The individual values were normalized to α-actin. n = 4 per group. **p<0.01. **p<0.05.